

● Live
🚀 Trendhoo [v5] by @DaviddTech 🤖 [7d12b66d]
🛡️ TRENDHOO RUNE 1H
Trading Pair
RUNE
Base Currency
Performance Overview
Total Return
Primary
672%
Net Profit Performance
Win Rate
Success
54.87%
Trade Success Ratio
Max Drawdown
Risk
45.55%
Risk Control
Profit Factor
Efficiency
1.171
Risk-Reward Ratio
Incubation Delta
Live
-98.04%
Live vs Backtest
Total Trades
Volume
483
Executed Trades
Equity Curve Analysis
Performance comparison between backtest and live trading results
Backtest Performance
Live Trading
First Trade
Mar 29, 2022
1,308
Days
483
Trades
Last Trade
Oct 20, 2025
All backtests include realistic trading fees and slippage
Strategy Analysis & Data
Comprehensive performance metrics and detailed analysis
Performance Metrics
Detailed trading performance analysis and key metrics
Trades per Day
Key Performance Metrics
- First Traded Date: 2022-03-29 13:30:00
- Sharpe Ratio: 0.43
- Sortino Ratio: 1.22
- Calmar: -1.72
- Longest DD Days: 188.00
- Volatility: 61.23
- Skew: 1.58
- Kurtosis: 5.07
- Expected Daily: 0.49
- Expected Monthly: 10.81
- Expected Yearly: 242.90
- Kelly Criterion: 8.57
- Daily Value-at-Risk: -4.85
- Expected Shortfall (cVaR): -5.69
- Last Trade Date: 2025-10-20 05:30:00
- Max Consecutive Wins: 8
- Number Winning Trades 265
- Max Consecutive Losses: 7
- Number Losing Trades: 218
- Gain/Pain Ratio: -1.72
- Gain/Pain (1M): 1.18
- Payoff Ratio: 0.97
- Common Sense Ratio: 1.18
- Tail Ratio: 1.62
- Outlier Win Ratio: 3.98
- Outlier Loss Ratio: 0.00
- Recovery Factor: 0.00
- Ulcer Index: 0.19
- Serenity Index: 18.87
Trade Analysis
Individual trade breakdown and analysis
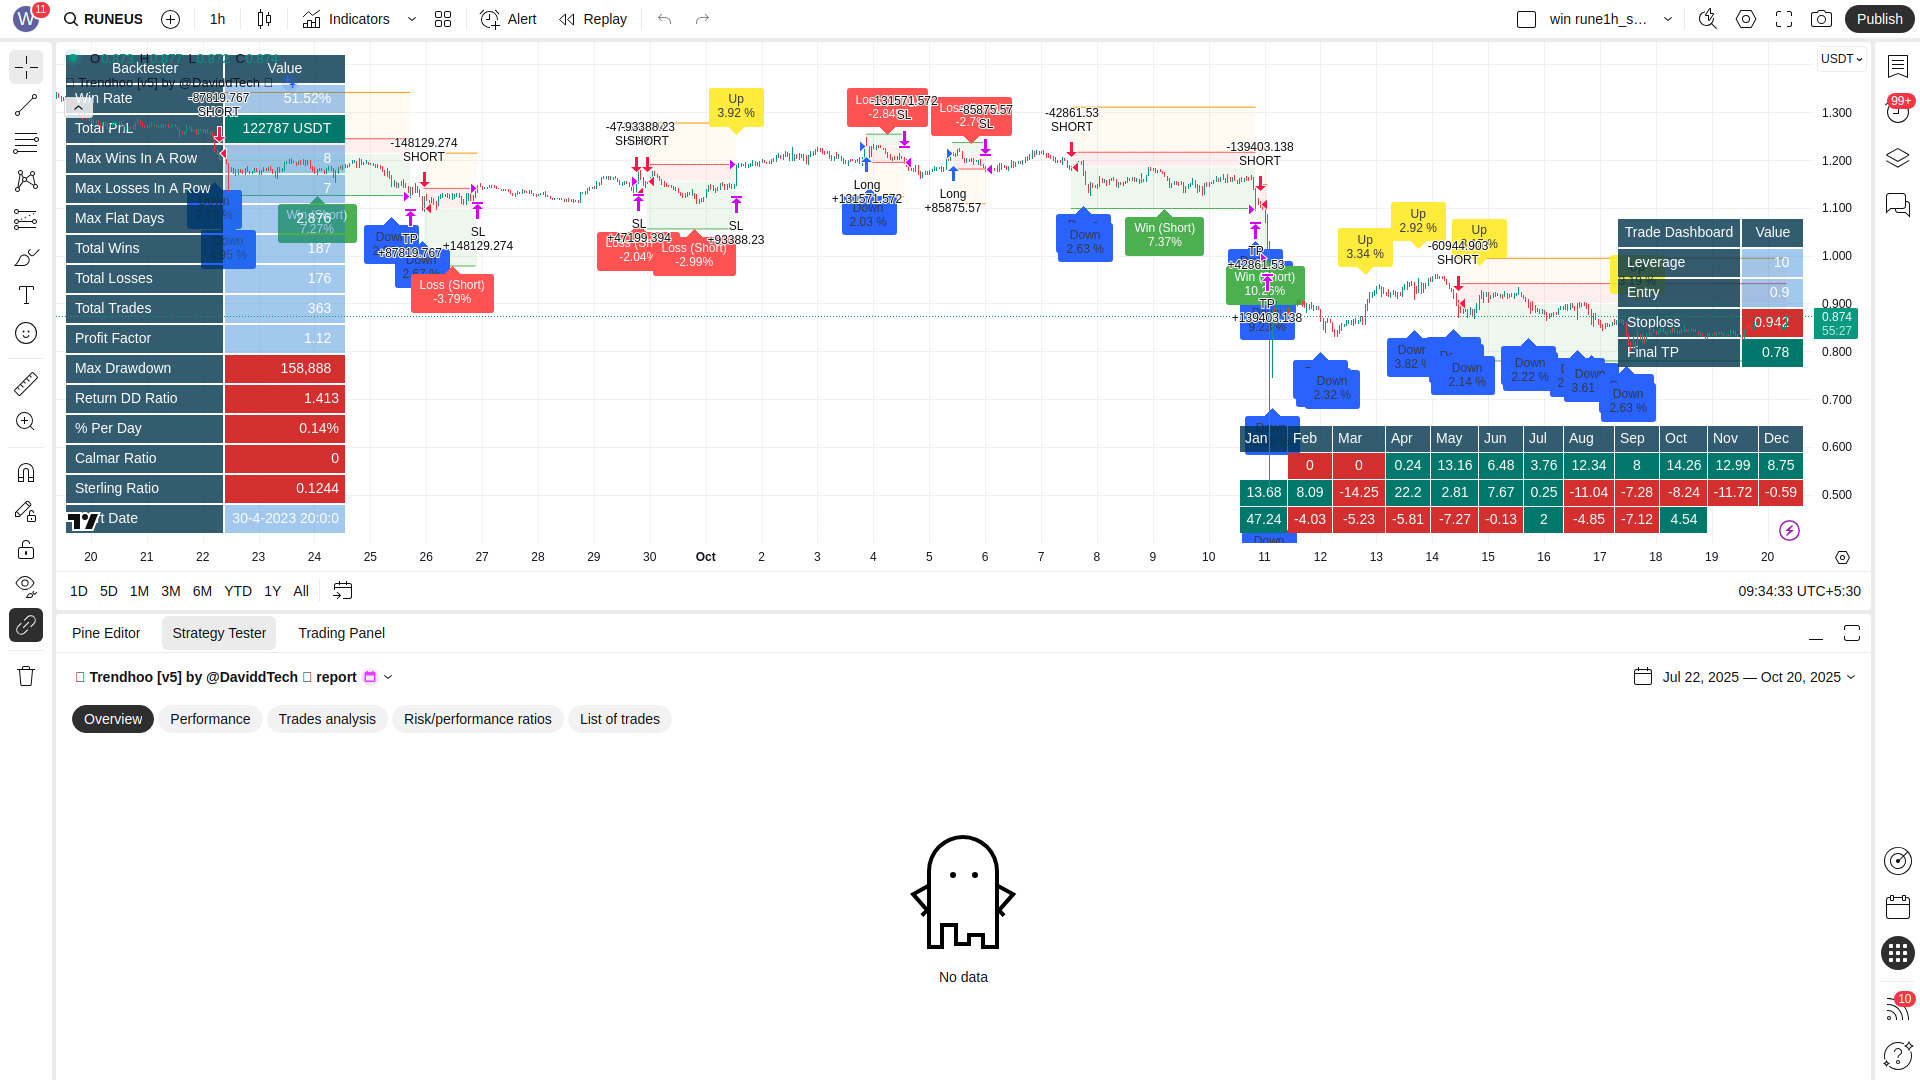
List of Trades
Key : Pink Background = Live Trades | Black Background = Backtest Trades
Monthly Profit & Loss
Monthly performance breakdown with profit/loss indicators
📊 Detailed Monthly Performance Analysis
Comprehensive monthly breakdown showing both cumulative (compounded) returns and simple P&L sums. Each cell displays both metrics for complete transparency.
Incubation Period
Live Trading
| Year/Month | January | February | March | April | May | June | July | August | September | October | November | December |
|---|---|---|---|---|---|---|---|---|---|---|---|---|
| 2022 | +0.00% +0.00% Simple P&L | +0.00% +0.00% Simple P&L | -1.36% -1.67% Simple P&L | +23.51% +49.06% Simple P&L | +12.46% +5.40% Simple P&L | +34.88% +38.18% Simple P&L | -0.45% -0.15% Simple P&L | +20.96% +34.22% Simple P&L | +21.09% +0.34% Simple P&L | -2.73% +12.23% Simple P&L | +35.12% +13.32% Simple P&L | +45.08% +23.97% Simple P&L |
| 2023 | +12.18% +8.89% Simple P&L | +23.54% -3.49% Simple P&L | -1.24% +17.38% Simple P&L | +71.35% +11.88% Simple P&L | +17.19% +21.55% Simple P&L | +4.40% +1.55% Simple P&L | +10.44% +3.61% Simple P&L | +53.75% +10.96% Simple P&L | +39.16% +7.18% Simple P&L | +75.34% +15.54% Simple P&L | +78.43% +16.42% Simple P&L | +96.90% -10.59% Simple P&L |
| 2024 | +61.78% +33.57% Simple P&L | +68.06% +3.94% Simple P&L | -129.51% -19.83% Simple P&L | +153.20% +28.12% Simple P&L | +51.44% +5.32% Simple P&L | +134.71% +4.09% Simple P&L | -58.52% +4.11% Simple P&L | -117.09% -12.46% Simple P&L | -68.64% -13.57% Simple P&L | -72.02% -16.67% Simple P&L | -94.05% -21.52% Simple P&L | -4.16% -13.36% Simple P&L |
| 2025 | +332.99% +71.64% Simple P&L | -130.74% -4.97% Simple P&L | -52.52% -17.10% Simple P&L | Login to see results | Login to see results | Login to see results | Login to see results | Login to see results | Login to see results | Login to see results | +0.00% +0.00% Simple P&L | +0.00% +0.00% Simple P&L |
Live Trading Statistics
Real-time trading performance and statistics
Live Trades Stats
484
Number of Trades
682.59%
Cumulative Returns
54.96%
Win Rate
2024-02-15
🟠 Incubation started
🛡️
7 Days
11.96%
30 Days
8.32%
60 Days
5.99%
90 Days
Strategy Audit & Screenshots
Visual verification of strategy performance with TradingView screenshots
| All USD | All % | Long USD | Long % | Short USD | Short % | |
|---|---|---|---|---|---|---|
| Open P&l | 0.0 | 0.0 | ||||
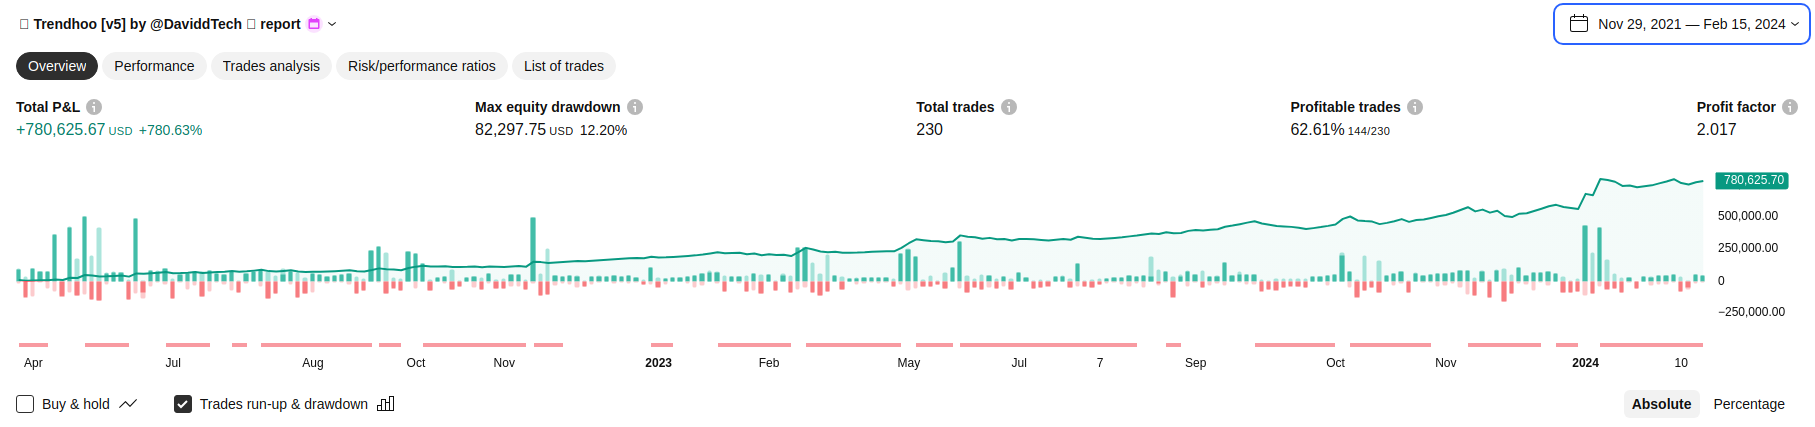
| Net Profit | 780625.67 | 780.63 | 337562.15 | 337.56 | 443063.52 | 443.06 |
| Gross Profit | 1547970.08 | 1547.97 | 866546.76 | 866.55 | 681423.32 | 681.42 |
| Gross Loss | 767344.4 | 767.34 | 528984.61 | 528.98 | 238359.79 | 238.36 |
| Commission Paid | 52545.38 | 41965.02 | 10580.36 | |||
| Buy & Hold Return | -51007.24 | -51.01 | ||||
| Max Equity Run-up | 817588.18 | 89.24 | ||||
| Max Drawdown | 82297.75 | 12.2 | ||||
| Max Contracts Held | 358842.0 | 331028.0 | 358842.0 | |||
| Total Closed Trades | 230.0 | 174.0 | 56.0 | |||
| Total Open Trades | 0.0 | 0.0 | 0.0 | |||
| Number Winning Trades | 144.0 | 122.0 | 22.0 | |||
| Number Losing Trades | 86.0 | 52.0 | 34.0 | |||
| Percent Profitable | 62.61 | 70.11 | 39.29 | |||
| Avg P&l | 3394.02 | 1.35 | 1940.01 | 0.68 | 7911.85 | 3.45 |
| Avg Winning Trade | 10749.79 | 4.69 | 7102.84 | 2.81 | 30973.79 | 15.11 |
| Avg Losing Trade | 8922.61 | 4.23 | 10172.78 | 4.32 | 7010.58 | 4.09 |
| Ratio Avg Win / Avg Loss | 1.205 | 0.698 | 4.418 | |||
| Largest Winning Trade | 126740.09 | 43660.26 | 126740.09 | |||
| Largest Winning Trade Percent | 27.17 | 10.84 | 27.17 | |||
| Largest Losing Trade | 41228.43 | 41228.43 | 19914.21 | |||
| Largest Losing Trade Percent | 8.56 | 8.56 | 7.98 | |||
| Avg # Bars In Trades | 39.0 | 11.0 | 124.0 | |||
| Avg # Bars In Winning Trades | 37.0 | 9.0 | 194.0 | |||
| Avg # Bars In Losing Trades | 41.0 | 16.0 | 79.0 | |||
| Sharpe Ratio | 1.094 | |||||
| Sortino Ratio | 10.795 | |||||
| Profit Factor | 2.017 | 1.638 | 2.859 | |||
| Margin Calls | 0.0 | 0.0 | 0.0 |
| All USD | All % | Long USD | Long % | Short USD | Short % | |
|---|---|---|---|---|---|---|
| Open P&l | 10773.68 | 1.4 | ||||
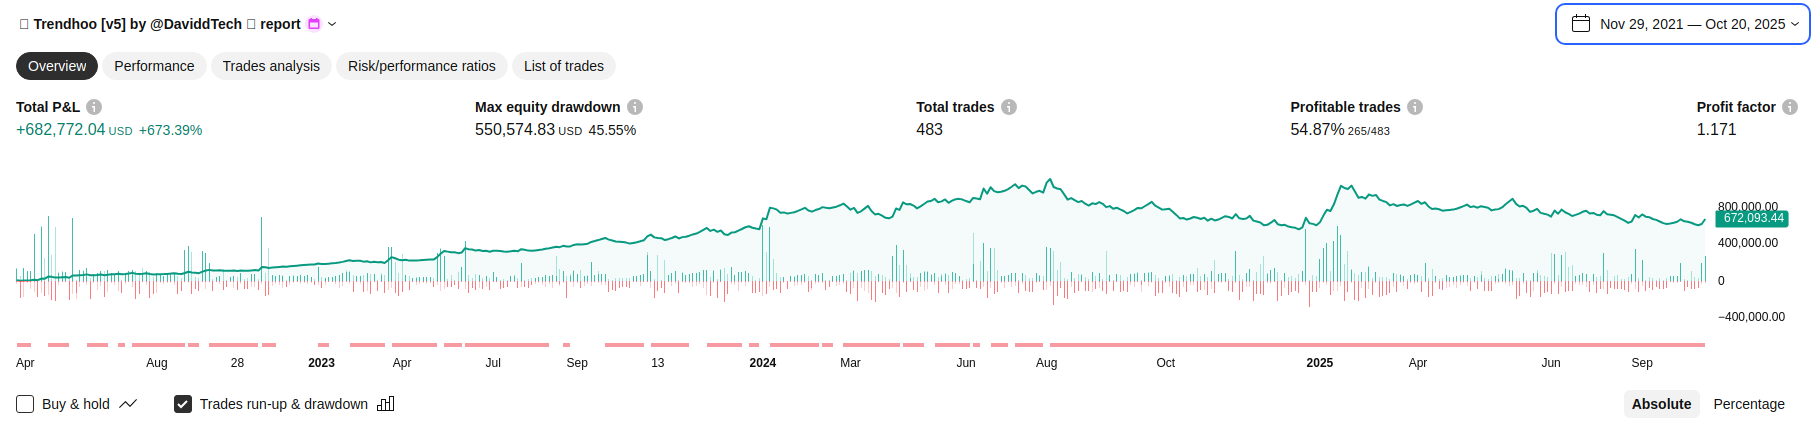
| Net Profit | 671998.36 | 672.0 | -102698.25 | -102.7 | 774696.61 | 774.7 |
| Gross Profit | 4604977.33 | 4604.98 | 2384650.4 | 2384.65 | 2220326.94 | 2220.33 |
| Gross Loss | 3932978.98 | 3932.98 | 2487348.65 | 2487.35 | 1445630.33 | 1445.63 |
| Commission Paid | 177524.76 | 131603.57 | 45921.18 | |||
| Buy & Hold Return | -92596.14 | -92.6 | ||||
| Max Equity Run-up | 1222196.47 | 92.53 | ||||
| Max Drawdown | 550574.83 | 45.55 | ||||
| Max Contracts Held | 739648.0 | 625774.0 | 739648.0 | |||
| Total Closed Trades | 483.0 | 349.0 | 134.0 | |||
| Total Open Trades | 1.0 | 0.0 | 1.0 | |||
| Number Winning Trades | 265.0 | 218.0 | 47.0 | |||
| Number Losing Trades | 218.0 | 131.0 | 87.0 | |||
| Percent Profitable | 54.87 | 62.46 | 35.07 | |||
| Avg P&l | 1391.3 | 0.59 | -294.26 | 0.07 | 5781.32 | 1.94 |
| Avg Winning Trade | 17377.27 | 4.8 | 10938.76 | 2.84 | 47241.0 | 13.86 |
| Avg Losing Trade | 18041.19 | 4.54 | 18987.39 | 4.56 | 16616.44 | 4.51 |
| Ratio Avg Win / Avg Loss | 0.963 | 0.576 | 2.843 | |||
| Largest Winning Trade | 126740.09 | 44885.57 | 126740.09 | |||
| Largest Winning Trade Percent | 27.17 | 10.84 | 27.17 | |||
| Largest Losing Trade | 87179.61 | 68172.63 | 87179.61 | |||
| Largest Losing Trade Percent | 10.45 | 8.69 | 10.45 | |||
| Avg # Bars In Trades | 32.0 | 11.0 | 86.0 | |||
| Avg # Bars In Winning Trades | 31.0 | 9.0 | 132.0 | |||
| Avg # Bars In Losing Trades | 33.0 | 15.0 | 60.0 | |||
| Sharpe Ratio | 0.434 | |||||
| Sortino Ratio | 1.224 | |||||
| Profit Factor | 1.171 | 0.959 | 1.536 | |||
| Margin Calls | 0.0 | 0.0 | 0.0 |
TradingView Screenshots
Slide this way to reveal live trades
USE SLIDER TO REVEAL RESULTS
Slide this way to reveal backtest
Slide this way to reveal live trades
USE SLIDER TO REVEAL RESULTS
Slide this way to reveal backtest
⚪️ Other Backtest
AI Quantitative Analysis
Advanced AI-powered insights and strategy analysis
AI Quantitative Analyst
Ready to analyze
Risk Analysis
Performance Metrics
Market Insights
📈 Risk-Reward Analysis
📊 Performance Metrics
🎯 Market Comparison
Advanced Markov Motor Analysis
Sophisticated analysis of strategy edge degradation, rolling metrics, and Markov chain properties
Analysis Controls
Live Analysis
20
trades
1.2
PF
Rolling Performance Metrics
Current Trend
Analyzing...
Edge Strength
Calculating...
Markov State Transitions
W
L
Win/Loss States
Transition Probabilities
From/To
Win
Loss
Win
0.00
0.00
Loss
0.00
0.00
Edge Decay Analysis
Edge Intact
Consistency Score
--
Stability Index
--
Trend Strength
--
Return Distribution Analysis
Skewness
--
Kurtosis
--
Tail Risk
--
Market Regime Detection
Analyzing...
Favorable Regime %
--
Avg Regime Duration
--
Current Regime Age
--
Markov Intelligence Insights
Analyzing strategy patterns...
Choose your Reaction!


